Interaction discovery for logistic regression
N.B.: ce post s’inspire librement de mon manuscrit de thèse.
Continuing our pursuit of interpretable representation learning algorithms for logistic regression, we tackle in this post a common problem in Credit Scoring and other application contexts relying either on logistic regression or additive models of the form \(f(y) = \sum_{j=1}^d \boldsymbol{q}_j(x_j)' \boldsymbol{\theta}_j\). To further reduce the model bias and thus obtain better predictive performance while maintaining interpretability, Credit Scoring practitioners are used to introducing pairwise interactions.
Motivation: XOR function
As described in the introduction, logistic regression is linear in its inputs which does not allow to take into account conditional dependency: the change of slope of a feature’s log-odds given another (moderator) feature (see (25)). This problem is often dealt with by sparsely introducing “interactions”, i.e. products of two features. Unfortunately, this leads again to a model selection challenge as the number of pairs of features is \(\dfrac{d(d-1)}{2}\). We denote by \(\boldsymbol{\delta}\) the triangular inferior matrix with δk, ℓ = 1 if k < ℓ and features k and ℓ “interact” in the logistic regression in the sense of (25). The logistic regression with interactions \(\boldsymbol{\delta}\) is thus:
$$\label{eq:reglog_sans}
%\text{logit}[p_{\boldsymbol{\theta}}(1|\boldsymbol{q}(\boldsymbol{x}),\boldsymbol{\delta})] = \theta_{0} + \sum_{j=1}^d \boldsymbol{q}_j(x_j)' \boldsymbol{\theta}_j + \sum_{1 \leq k < \ell \leq d} \delta_{k,\ell} \sigma( \boldsymbol{\theta}_{k,\ell} \odot \boldsymbol{q}_k(x_k) \boldsymbol{q}_\ell(x_\ell)' ),
\text{logit}[p_{\boldsymbol{\theta}}(1|\boldsymbol{q}(\boldsymbol{x}),\boldsymbol{\delta})] = \theta_{0} + \sum_{j=1}^d \boldsymbol{q}_j(x_j)' \boldsymbol{\theta}_j + \sum_{1 \leq k < \ell \leq d} \delta_{k,\ell} \boldsymbol{q}_k(x_k)' \boldsymbol{\theta}_{k,\ell} \boldsymbol{q}_\ell(x_\ell),$$
where \(\boldsymbol{\theta}_{j} = (\theta_j^1, \theta_j^{m_j})\), \(\boldsymbol{\theta}_{k,\ell} = (\theta_{k,\ell}^{r,t})_{1 \leq r \leq m_k, 1 \leq t \leq m_\ell}\) and for all features j, \(m_j\) is set as the “reference” value and consequently for all j, \(\theta_{j}^{m_j}=0\) and for all 1 ≤ k < ℓ ≤ d, θk, ℓmk, mℓ = 0. The resulting coefficient \(\boldsymbol{\theta}\) is the vector of all main effects \((\boldsymbol{\theta}_j)_1^d\) and the interaction coefficients \((\boldsymbol{\theta}_{k,\ell})_{1 \leq k,\ell \leq d}\).
Since, in presence of an interaction between k and ℓ, \(\boldsymbol{\theta}_{k}\) already encodes the log-odd ratio of feature k conditionally to ℓ being at its reference value mℓ, θk, ℓ1, mℓ, …, θk, ℓmk − 1, mℓ are redundant and thus set to 0. Note that we could have removed the “main effect” \(\boldsymbol{\theta}_k\) altogether instead (which is the classical, in-house formulation of interactions at CACF) but since we will be adding / removing interactions back and forth, the present formulation seems more adequate.
This formulation seems rather complicated visually and in terms of parameter dimension: a single interaction between two quantized features (or more broadly speaking, categorical features) amounts to adding (mk − 1) ⋅ (mℓ − 1) coefficients. Since we advocated “interpretable”, i.e. sparse, simple models to yield scorecards, it does not seem like a good idea. As a side note, interpretation of the resulting parameters can be rather tricky. The monographs (1), (2) were really helpful and are sincerely recommended to the interested reader.
Nevertheless, as thoroughly explained in (25), there are situations where interactions terms are unavoidable. A simple (but quite extreme) example is the XOR (exclusive or) function f(x1, x2) = (x1 + x2) ⋅ (2 − x1 − x2) where x1, x2 ∈ {0, 1}. Such functions cannot be learnt by a standard logistic regression. For a more illustrative example, the broad field of medicine is often interested in knowing the factors of risks of a given disease and if these factors have additive or cumulative effects (see (3) for an example), e.g. risk of contracting disease A is doubled with factors B and C individually, but 6 times more when both factors are present. This is precisely what is observed in the Credit Scoring industry: we observe higher risk among workers than executives but when associated with the time spent in the current job position, workers with “stability” of employment may appear less risky than less “stable” executives in a non-additive way.
Moreover, the number of coefficients is nevertheless kept low by having few levels and few interactions, as emphasized by the \(\boldsymbol{\delta}\) notation. Additionally and traditionally in Credit Scoring, so-called “main-effects”, i.e. features \(\boldsymbol{q}_k(x_k)\) and \(\boldsymbol{q}_\ell(x_\ell)\) are removed when their interaction term is present (δk, ℓ = 1) because as stated earlier, on categorical features, it is strictly equivalent, which is not true in the general case (mixed data). In biostatistics for example, it is usually the contrary (interactions are only considered when main effects are present), as will be seen in the following section, where a literature review is given, alongside a reformulation of the problem.
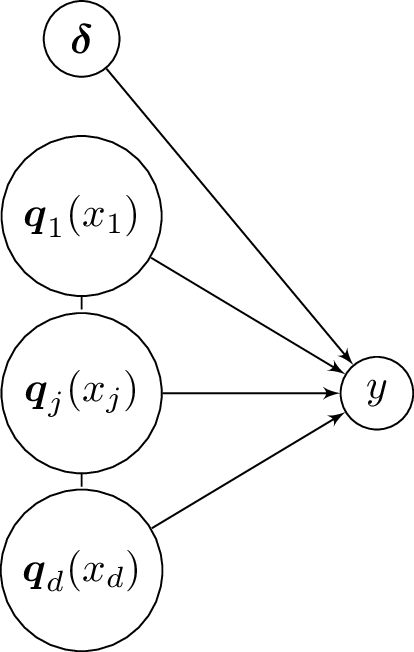
Besides, we assume the dependence structure of Figure [1] such that:
$$\begin{aligned}
p(\boldsymbol{\delta} | \boldsymbol{q}(\boldsymbol{x}) & = p(\boldsymbol{\delta}), \label{indep:delta} \\
p(\boldsymbol{q}(\boldsymbol{x}) | \boldsymbol{\delta}) & = p(\boldsymbol{q}(\boldsymbol{x})). \label{indep:qx}\end{aligned}$$
Pairwise interaction screening as a feature selection problem
The following criterion can be used to select interactions:
$$\label{eq:criterion_inter}
(\boldsymbol{q}^\star,\boldsymbol{\delta}^\star) = \arg\!\min_{\boldsymbol{q} \in \boldsymbol{q}, \boldsymbol{\delta} \in \{0,1\}^{\frac{d(d-1)}{2})}} \text{BIC}(\hat{\boldsymbol{\theta}}_{\boldsymbol{q},\boldsymbol{\delta}}),$$
where \(\hat{\boldsymbol{\theta}}_{\boldsymbol{q},\boldsymbol{\delta}}\) is the MLE of \(\boldsymbol{\theta}\) given \(\mathcal{T}_{\text{f}}\), \(\boldsymbol{q}\) and \(\boldsymbol{\delta}\). Here, δk, ℓ is an estimated parameter of the model and an additional \(\frac{d(d-1)}{2}\) term shall be added to the penalization term ν of the BIC criterion. The combinatorics involved in this problem are much higher than those involved solely in the quantization problem, which already lead to an intractable greedy approach. For each feasible quantization scheme, there is now \(2^{\frac{d(d-1)}{2}}\) models to test! In this section, we will first consider the discretization fixed and develop a stochastic approach similar to the one proposed for quantization.
With a fixed quantization scheme \(\boldsymbol{q}\), the above mentioned BIC criterion amounts to \(\boldsymbol{\delta}^\star = \arg\!\min_{\boldsymbol{\delta}} \text{BIC}(\hat{\boldsymbol{\theta}}_{\boldsymbol{q},\boldsymbol{\delta}})\) which optimization through a greedy approach is intractable with more than a few features (d > 10). The first approach that seems straightforward in this setting is to simply see all \(\frac{d(d-1)}{2}\) interactions as features to select from. It is worth mentioning that software to do so is available, for example in the R package glmulti (4) which is not restricted to interaction screening but aims at selecting features based on e.g. the BIC criterion. It can build all subset models of the hypothesis space or, optionnally, conduct a random search using a genetic algorithm. However, with interactions, the search space is too vast to do such a brute force algorithm. In this potentially high-dimensional parameter space, the most computationnaly-effective approach is to resort to penalization. Various penalization approaches have been developed recently, among which LASSO (5) and its derivatives can effectively perform feature selection. A CIFRE PhD has even been dedicated to the subject with application to Credit Scoring (24).
The penalization approach has been applied to the interaction screening problem, very often in biostatistics-related problems, e.g. gene-gene interactions. Its first use (6) relies on L2 regularization, for stability of estimation of the large number of coefficients, and forward stagewise selection of features to avoid a phenomenon where an interaction between a meaningful feature and a meaningless one would remain in the model: it would imply that the main effect coefficient of the meaningful feature could be lower, and thus preferable w.r.t. the L2 penalty. The LASSO has been applied to this problem as well (7) by first selecting features with the LASSO based solely on main effects, then selecting pairwise interactions among the selected main effects, again with the LASSO, which requires all main effects of the considered interactions to be present in the model. Rather than conducting such a two-stage procedure, which might greatly influence the considered interactions and does not work under the “weak hierarchy” hypothesis (only one of the features of a pairwise interaction need to be present as a main effect), a set of convex constraints is added to the LASSO in (8) such that main effects and pairwise interactions are selected in a one-shot procedure with the hierarchy constraint. Other stepwise methods have been proposed, e.g. relying on χ2 tests (9) or on a Reversible-Jump MCMC method (10), (11) which resembles what is proposed in this post but is not limited to pairwise interactions at the cost of added computational complexity. In a different setting, with much stricter hypotheses on the data, namely that they are Gaussian for each class, a statistical test involving the sample pairwise correlations is derived in (12) to characterize the probability of an interaction. Other works (13), (14) focus on this setting and propose a stepwise procedure and a dimensionality reduction technique respectively. Finally, a much simpler intuition found in (25), on which we rely in subsequent sections, is that testing for the presence of interaction in bivariate logistic regression (for all pairs of features) is roughly equivalent to the full multivariate logistic regression (in absence of correlation) but is much simpler since it amounts to construct 2d(d − 1)/2 bivariate logistic regression and conduct a t-test for each interaction coefficient.
Model-free approaches have been proposed in the biostatistics literature ((15), (16), (17), (18), (19), (20) and references therein) where focus is given to large d, small n settings. Moreover, these approaches are not multivariate (i.e. other features than the ones involved in the pair that is tested are discarded) and are not directly applicable to a particular predictive model \(p_{\boldsymbol{\theta}}\). Since interaction screening will be considered alongside quantization, we discard these methods from the present study.
A novel model selection approach
We take another approach here, which foremost benefit will appear in the subsequent section, and which closely resembles the strategy employed in the quantization setting and in particular the Stochastic-EM approach. The variable \(\boldsymbol{\delta}\) can be seen as an observation of a latent random matrix so that we will employ a stochastic approach to search for \(\boldsymbol{\delta}^\star\).
Relation of the BIC criterion and the interaction probability
The BIC criterion has a desirable property, from a Bayesian perspective, relating it to the likelihood of the data given the model (in our case, a given interaction matrix \(\boldsymbol{\delta}\)) given the data (see (21)), where the parameter space Θ depends on the model \(\boldsymbol{\delta}\):
$$\begin{aligned}
p(\boldsymbol{q}(\boldsymbol{\mathbf{x}}_{\text{f}}), \boldsymbol{\mathbf{y}}_{\text{f}} | \boldsymbol{\delta}) & = \int_{\Theta} p_{\boldsymbol{\theta}}(\boldsymbol{q}(\boldsymbol{\mathbf{x}}_{\text{f}}), \boldsymbol{\mathbf{y}}_{\text{f}} | \boldsymbol{\delta}) p(\boldsymbol{\theta} | \boldsymbol{\delta})d\boldsymbol{\theta} \\
& = \int_{\Theta} p_{\boldsymbol{\theta}}(\boldsymbol{\mathbf{y}}_{\text{f}} | \boldsymbol{q}(\boldsymbol{\mathbf{x}}_{\text{f}}), \boldsymbol{\delta}) p(\boldsymbol{\theta} | \boldsymbol{\delta}) p(\boldsymbol{q}(\boldsymbol{\mathbf{x}}_{\text{f}} | \boldsymbol{\delta})) d\boldsymbol{\theta} \\
& = \int_{\Theta} p_{\boldsymbol{\theta}}(\boldsymbol{\mathbf{y}}_{\text{f}} | \boldsymbol{q}(\boldsymbol{\mathbf{x}}_{\text{f}}), \boldsymbol{\delta}) p(\boldsymbol{\theta} | \boldsymbol{\delta}) p(\boldsymbol{q}(\boldsymbol{\mathbf{x}}_{\text{f}})) d\boldsymbol{\theta} & \text{.}\end{aligned}$$
Thus, we have:
$$\begin{aligned}
\ln p(\boldsymbol{q}(\boldsymbol{\mathbf{x}}_{\text{f}}), \boldsymbol{\mathbf{y}}_{\text{f}} | \boldsymbol{\delta}) & = \int_{\Theta} \ln p_{\boldsymbol{\theta}}(\boldsymbol{\mathbf{y}}_{\text{f}} | \boldsymbol{q}(\boldsymbol{\mathbf{x}}_{\text{f}}), \boldsymbol{\delta}) p(\boldsymbol{\theta} | \boldsymbol{\delta}) d\boldsymbol{\theta} + \ln p(\boldsymbol{q}(\boldsymbol{\mathbf{x}}_{\text{f}})) \\
& = -\text{BIC}(\hat{\boldsymbol{\theta}}_{\boldsymbol{\delta}})/2 + \ln p(\boldsymbol{q}(\boldsymbol{\mathbf{x}}_{\text{f}})) + O(1).\end{aligned}$$
Rewriting the posterior probability of the model by introducing the preceding likelihood, we get:
$$\begin{aligned}
p(\boldsymbol{\delta} | \boldsymbol{q}(\boldsymbol{\mathbf{x}}_{\text{f}}),\boldsymbol{\mathbf{y}}_{\text{f}}) & \propto p(\boldsymbol{\mathbf{y}}_{\text{f}} | \boldsymbol{q}(\boldsymbol{\mathbf{x}}_{\text{f}}), \boldsymbol{\delta}) p(\boldsymbol{\delta}) \\
& \propto p(\boldsymbol{\mathbf{y}}_{\text{f}} | \boldsymbol{q}(\boldsymbol{\mathbf{x}}_{\text{f}}), \boldsymbol{\delta}) p(\boldsymbol{\delta} | \boldsymbol{q}(\boldsymbol{\mathbf{x}}_{\text{f}})) & \\
& \approx \exp(-\text{BIC}(\hat{\boldsymbol{\theta}}_{\boldsymbol{q},\boldsymbol{\delta}})/2) p(\boldsymbol{\delta}).\end{aligned}$$
This last expression will be useful to design a stochastic algorithm proposing clever interaction matrices: the Metropolis-Hastings algorithm described hereafter.
Metropolis-Hastings sampling algorithm
This section is dedicated to describing the Metropolis-Hastings (22) sampling algorithm that will be used in the next section to sample from \(p(\boldsymbol{\delta} | \boldsymbol{q}(\boldsymbol{\mathbf{x}}),\boldsymbol{\mathbf{y}})\) that will be denoted, for simplicity, by \(\pi(\boldsymbol{\delta})\) in this section.
The distribution \(\pi(\boldsymbol{\delta})\) is not known explicitly but \(f(\boldsymbol{\delta}) = \exp(-\text{BIC}(\hat{\boldsymbol{\theta}}_{\boldsymbol{q},\boldsymbol{\delta}})/2) p(\boldsymbol{\delta})\) is approximately proportional to \(\pi(\boldsymbol{\delta})\). Consequently, given two matrices \(\boldsymbol{\delta}\) and \(\boldsymbol{\delta}'\), the pdf ratio is: \(\frac{\pi(\boldsymbol{\delta})}{\pi(\boldsymbol{\delta}')} \approx \frac{f(\boldsymbol{\delta})}{f(\boldsymbol{\delta}')}\).
Now suppose we have at our disposal a transition kernel, that defines a probability distribution, of the form:
$$\begin{aligned}
T: \; & ({\{0,1\}}^{\frac{d(d-1)}{2}},{\{0,1\}}^{\frac{d(d-1)}{2}}) && \to [0;1] \nonumber \\
& (\boldsymbol{\delta},\boldsymbol{\delta}') && \mapsto T(\boldsymbol{\delta},\boldsymbol{\delta}'). \nonumber\end{aligned}$$
This instrumental conditional distribution will be used to design a Markov Chain which empirical distribution of drawn matrices \(\boldsymbol{\delta}^{(0)}, \dots, \boldsymbol{\delta}^{(\text{iter})}\) approaches \(\pi(\boldsymbol{\delta})\). The algorithm is the following:
This algorithm reaches asymptotically the target distribution \(\pi(\boldsymbol{\delta})\) if such a stationary distribution exists and is unique (23). “Detailed balance” is a sufficient but not necessary condition of existence according to which each transition \(\boldsymbol{\delta}^{(s)} \rightarrow \boldsymbol{\delta}^{(s+1)}\) is reversible. Uniqueness is guaranteed if the resulting Markov Chain is ergodic. This is satisfied if every interaction matrix \(\boldsymbol{\delta}\) is aperiodic and positive recurrent ( each matrix \(\boldsymbol{\delta} \in {\{0,1\}}^{\frac{d(d-1)}{2}}\) is reachable in a finite number of iterations).
It is also important to notice that, apart from verifying the above assumptions, there are no guidelines about how to choose the proposal distribution or the number of iterations necessary for proper estimation. These are “hyperparameters” that may influence greatly the effectiveness of the method.
Designing a Markov Chain of good interactions
It follows from the preceding section that one can design a Metropolis-Hastings algorithm which draws “good” interaction matrices \(\boldsymbol{\delta}\) from the target posterior distribution \(p(\boldsymbol{\delta} | \boldsymbol{q}(\boldsymbol{\mathbf{x}}),\boldsymbol{\mathbf{y}})\).
Transition probability
Metropolis-Hastings only requires a proposal of a transition probability between two matrices of the Markov chain that was denoted by \(T\). This approach would require to compute 2d(d − 1) probabilities (i.e. one per unique couple of matrices (\(\boldsymbol{\delta},\boldsymbol{\delta}'\))). It is thus desirable to reduce this combinatorics by making further assumptions. In what follows, we restrict possible transitions to matrices that are on a one unit L1, 1 distance (sum of all absolute entries) to the current interaction matrix, or equivalently which belong to the \(\left( \frac{d(d-1)}{2}-1 \right)\)-sphere of center \(\boldsymbol{\delta}\) denoted by \(S^{\left( \frac{d(d-1)}{2}-1 \right)}_{\boldsymbol{\delta}}\):
$$\begin{aligned}
T(\boldsymbol{\delta},\boldsymbol{\delta}') = 0 & \text{ if } \sum_{k=1}^d \sum_{\ell=1}^d |\delta_{k,\ell} - \delta'_{k,\ell}| \neq 1 \\
& \equiv ||\boldsymbol{\delta} - \boldsymbol{\delta}'||_{1,1} \neq 1 \\
& \equiv \boldsymbol{\delta}' \not\in S^{\left( \frac{d(d-1)}{2}-1 \right)}_{\boldsymbol{\delta}}.\end{aligned}$$
Only \(\frac{d(d-1)}{2}\) coefficients are now needed, which can be reinterpreted as the probability to switch on (resp. off) an entry of \(\boldsymbol{\delta}\) which is currently off (resp. on). We claim that a good intuition about whether two features interact is the relative gain (or loss) in BIC between their bivariate model with their interaction and this model without their interaction. The rationale behind such a procedure, relying again on the properties of BIC, is the following:
$$\begin{aligned}
\forall \: 1 \leq k < \ell \leq d, \; p(\delta_{k,\ell} | \boldsymbol{q}_k(\boldsymbol{\mathbf{x}}_{\text{f},k}), \boldsymbol{q}_\ell(\boldsymbol{\mathbf{x}}_{\text{f},\ell}), \boldsymbol{\mathbf{y}}_{\text{f}}) & \propto p(\boldsymbol{\mathbf{y}}_{\text{f}} | \boldsymbol{q}_k(\boldsymbol{\mathbf{x}}_{\text{f},k}), \boldsymbol{q}_\ell(\boldsymbol{\mathbf{x}}_{\text{f},\ell}), \delta_{k,\ell}) p(\delta_{k,\ell} | \boldsymbol{q}_k(\boldsymbol{\mathbf{x}}_k), \boldsymbol{q}_\ell(\boldsymbol{\mathbf{x}}_\ell)) \\
& \propto p(\boldsymbol{\mathbf{y}}_{\text{f}} | \boldsymbol{q}_k(\boldsymbol{\mathbf{x}}_{\text{f},k}), \boldsymbol{q}_\ell(\boldsymbol{\mathbf{x}}_{\text{f},\ell}), \delta_{k,\ell}) p(\delta_{k,\ell}) & \\
& \approx \exp(-\text{BIC}(\hat{\boldsymbol{\theta}}_{\boldsymbol{q}_k,\boldsymbol{q}_\ell,\delta_{k,\ell}})/2) p(\delta_{k,\ell}).\end{aligned}$$
Setting a uniform prior which will simplify all subsequent calculations (see next section) \(p(\delta_{k,\ell}=1) =\begin{cases} 0 \text{ if } k \geq \ell \\ \frac{1}{2} \text{ otherwise} \end{cases}\) and denoting by pk, ℓ the probability of an interaction given features \(\boldsymbol{q}_k(x_k)\) and \(\boldsymbol{q}_\ell(x_\ell)\):
$$\label{eq:pkl}
p_{k,\ell} = p(\delta_{k,\ell} = 1 | \boldsymbol{q}_k(\boldsymbol{\mathbf{x}}_k), \boldsymbol{q}_\ell(\boldsymbol{\mathbf{x}}_\ell), \boldsymbol{\mathbf{y}}) \propto \exp \left( \frac{\text{BIC}(\hat{\boldsymbol{\theta}}_{\boldsymbol{q}_k,\boldsymbol{q}_\ell,\delta_{k,\ell}=0}) - \text{BIC}(\hat{\boldsymbol{\theta}}_{\boldsymbol{q}_k,\boldsymbol{q}_\ell,\delta_{k,\ell}=1})}{2} \right).$$
We normalize pk, ℓ s.t. ∑1 ≤ k < ℓ ≤ dpk, ℓ = 1 and denote their triangular inferior matrix arrangement by P. Note that in this setting, we have nested models such that the approximation in [eq:pkl] is consistent in n. We claim that if pk, ℓ is close to 1 (resp. 0), then there is a strong chance that δk, ℓ⋆ = 1 (resp. δk, ℓ⋆ = 0) even in the full multivariate model, which amounts to:
$$p_{k,\ell} \approx p(\delta_{k,\ell} = 1 | \boldsymbol{q}(\boldsymbol{\mathbf{x}}_{\text{f}}),\boldsymbol{\mathbf{y}}_{\text{f}}) .$$
This holds in particular if features \(\boldsymbol{q}_k(\boldsymbol{\mathbf{x}}_k)\) and \(\boldsymbol{q}_\ell(\boldsymbol{\mathbf{x}}_\ell)\) are independent to other features \(\boldsymbol{q}_{-\{k,\ell\}}(\boldsymbol{\mathbf{x}}_{-\{k,\ell\}})\): the presence or absence of their interaction in the logistic regression \(p_{\boldsymbol{\theta}}(y | \boldsymbol{q}(\boldsymbol{x}), \boldsymbol{\delta})\) controlled by δk, ℓ depends solely on \(y, \boldsymbol{q}_k(\boldsymbol{\mathbf{x}}_k)\) and \(\boldsymbol{q}_\ell(\boldsymbol{\mathbf{x}}_\ell)\), as formalized in the following lemma.
Lemma
Our target distribution \(p(\delta_{k,\ell} = 1 | \boldsymbol{q}(\boldsymbol{\mathbf{x}}_{\text{f}}),\boldsymbol{\mathbf{y}}_{\text{f}})\) is equal to our instrumental distribution \(p_{k,\ell} = p(\delta_{k,\ell} = 1 | \boldsymbol{q}_k(\boldsymbol{\mathbf{x}}_{\text{f},k}), \boldsymbol{q}_\ell(\boldsymbol{\mathbf{x}}_{\text{f},\ell}), \boldsymbol{\mathbf{y}}_{\text{f}})\) if quantized features \(\boldsymbol{q}_k(\boldsymbol{\mathbf{x}}_{\text{f},k})\) and \(\boldsymbol{q}_\ell(\boldsymbol{\mathbf{x}}_{\text{f},\ell})\) are independent to other features \(\boldsymbol{q}_{-\{k,\ell\}}(\boldsymbol{\mathbf{x}}_{\text{f},-\{k,\ell\}})\).
Note also that in this setting and for n → + ∞, the first step of the Metropolis-Hastings described hereafter suffices since the pk, ℓ’s converge to δk, ℓ⋆ thanks to the properties of the BIC criterion.
Consequently, if at step (s) of the Markov chain, δk, ℓ(s) = 1 (resp. 0) and pk, ℓ is close to 0 (resp. 1), a good candidate for \(\boldsymbol{\delta}^{(s+1)}\) should be to change δk, ℓ to δk, ℓ(s + 1) = 0 (resp. δk, ℓ(s + 1) = 1). Our proposal is thus to calculate the difference between the current interaction matrix and P which is denoted by \(T^{(s)} = |\boldsymbol{\delta}^{(s)} - P|\) and normalized.
This defines a proper transition probability between two interaction matrices (⊙ denotes the element-wise Hadamard product):
$$T(\boldsymbol{\delta}^{(s)},\boldsymbol{\delta}') = \begin{cases} 0 \text{ if } ||\boldsymbol{\delta}^{(s)} - \boldsymbol{\delta}'||_{1,1} \neq 1, \\ T^{(s)} \odot |\boldsymbol{\delta}^{(s)} - \boldsymbol{\delta}'| \text{ otherwise}. \end{cases}$$
Acceptance probability of the proposed transition
A Metropolis-Hastings step can now be conducted by drawing \(\boldsymbol{\delta}' \sim T(\boldsymbol{\delta}^{(s)},\cdot)\). The acceptance probability of this candidate is given by:
$$\begin{aligned}
A & = \min \left( 1, \frac{p(\boldsymbol{\delta}' | \boldsymbol{q}(\boldsymbol{\mathbf{x}}_{\text{f}}), \boldsymbol{\mathbf{y}}_{\text{f}})}{p(\boldsymbol{\delta}^{(s)} | \boldsymbol{q}(\boldsymbol{\mathbf{x}}_{\text{f}}), \boldsymbol{\mathbf{y}}_{\text{f}})} \frac{1-T(\boldsymbol{\delta}^{(s)},\boldsymbol{\delta}')}{T(\boldsymbol{\delta}^{(s)},\boldsymbol{\delta}')} \right) \\
& \approx \min \left( 1, \exp \left( \frac{\text{BIC}(\hat{\boldsymbol{\theta}}_{\boldsymbol{q}(\boldsymbol{\mathbf{x}}_{\text{f}}),\delta_{k,\ell}=0}) - \text{BIC}(\hat{\boldsymbol{\theta}}_{\boldsymbol{q}(\boldsymbol{\mathbf{x}}_{\text{f}}),\delta_{k,\ell}=1})}{2} \right) \frac{1-T(\boldsymbol{\delta}^{(s)},\boldsymbol{\delta}')}{T(\boldsymbol{\delta}^{(s)},\boldsymbol{\delta}')} \right).\end{aligned}$$
It must here be remarked that by construction of \(T^{(s)}\) and the transition probability \(T(\boldsymbol{\delta}^{(s)},\boldsymbol{\delta}')\), we have \(T(\boldsymbol{\delta}',\boldsymbol{\delta}^{(s)}) = 1 - T(\boldsymbol{\delta}^{(s)},\boldsymbol{\delta}')\). The candidate \(\boldsymbol{\delta}'\) is accepted with probability A s.t. \(\boldsymbol{\delta}^{(s+1)} = \begin{cases} \boldsymbol{\delta}' \text{ with probability } A, \\ \boldsymbol{\delta}^{(s)} \text{ with probability } 1-A. \end{cases}\)
Validity of the approach
The existence of the stationary distribution \(p(\boldsymbol{\delta} | \boldsymbol{q}(\boldsymbol{\mathbf{x}}_{\text{f}}),\boldsymbol{\mathbf{y}}_{\text{f}})\) is guaranteed by construction of the Metropolis-Hastings algorithm as the generated Markov chain fulfills the detailed balance condition. The uniqueness of the stationary distribution is given by the ergodicity of the Markov chain: as \(\forall \: 1 \leq k < \ell \leq d, \: T_{k,\ell}^{(s)} > 0\) and a transition changes only one entry δk, ℓ of the interaction matrix, every state can be reached in at most \(\frac{d(d-1)}{2}\) steps.
In practice with a fixed quantization scheme, this stochastic approach is probably outperformed in computing time by LASSO-based methods or correlation-based methods like (12), which might obtain a suboptimal model in a fixed computing time, contrary to our approach which might take lots of steps to converge in distribution. Its double benefit however lies in the ability of the practitioner to define before-hand how many steps shall be performed and the natural integration to the quantization algorithm proposed in an earlier post, which we develop in the next section.
Interaction screening and quantization
We return to our original objective and consider optimizing the BIC criterion both in terms of quantization and pairwise interactions, as varying the quantization \(\boldsymbol{q}\) might influence the “best” interactions \(\boldsymbol{\delta}^\star\) and vice versa.
We can mix the MCMC approach proposed in the previous section with the glmdisc algorithm. A brute force way of doing this is to conduct a full Metropolis-Hastings algorithm, as proposed in the previous section, for each proposed quantization \(\hat{\boldsymbol{q}}^{(s)}\). Of course, this is too computationally intensive: our proposed Metropolis-Hastings algorithm necessitates the calculation of 2 bivariate logistic regression per pk, ℓ i.e. d(d − 1) logistic regressions and one logistic regression per step (s). These O(d2 + S) logistic regressions shall be estimated for each proposed quantization which itself requires the estimation of O(d) softmax or polytomous logistic regression and contingency tables. Focus is given to the glmdisc-SEM approach in what follows.
The foremost bottleneck lies in the aforementioned initialization of the Metropolis-Hastings algorithm. In essence, the proposed initialization is not required: the closer the proposal distribution to the target distribution, the quicker the convergence, which was our aim with the formulation of pk, ℓ. However, the asymptotic convergence in distribution is nevertheless maintained whatever proposal distribution is used, provided the resulting Markov Chain has a unique stationary distribution. We will consequently design a proposal distribution of \(\boldsymbol{\delta}\) for all quantizations \(\boldsymbol{\mathfrak{q}} \in \boldsymbol{\mathfrak{Q}}_{\boldsymbol{m}}\) (\(\boldsymbol{\mathfrak{q}}\) is the latent features representing the quantization \(\boldsymbol{q}(\boldsymbol{x})\) of \(\boldsymbol{x}\) and \(\boldsymbol{\mathfrak{Q}}_{\boldsymbol{m}}\) is the space of all latent quantizations with \(\boldsymbol{m} = (m_j)_1^d\) levels. To still put “prior” information (to the Markov Chain, it is not a priori in the Bayesian sense) about potential interactions into it, we will rely, to construct the transition kernel t from bivariate logistic regression, on the “raw” features instead:
$$\label{eq:pklnew}
p_{k,\ell} = p(\delta_{k,\ell} = 1 | \boldsymbol{\mathbf{x}}_k, \boldsymbol{\mathbf{x}}_\ell, \boldsymbol{\mathbf{y}}) \propto \exp \left( \frac{\text{BIC}(\hat{\boldsymbol{\theta}}_{x_k,x_\ell,\delta_{k,\ell}=0}) - \text{BIC}(\hat{\boldsymbol{\theta}}_{x_k,x_\ell,\delta_{k,\ell}=1})}{2} \right).$$
The second bottleneck is the number of Metropolis-Hastings steps per SEM step. It must be remembered that these two stochastic algorithms are meant to be used for their asymptotic properties. The target distribution of \(\boldsymbol{\mathfrak{q}}\) in the SEM algorithm is thought to be extremely dominated by \(\boldsymbol{\mathfrak{q}}^\star\), such that after some step (s), proposed quantizations are very close to \(\boldsymbol{q}^\star\) (and consequently very similar to each others) at which point the interaction screening algorithm while performing the quantization steps is somewhat similar to its “static” counterpart developed in the preceding section.
As a consequence, a single interaction matrix can be proposed at each step of the SEM-Gibbs algorithm proposed in an earlier post. Apart from the initialization defined above, nothing changes in the glmdisc-SEM algorithm: the SEM-Gibbs sampler allowed us to “hold” latent features \(\boldsymbol{\mathfrak{q}}_{-\{j\}}^{(s)}\) while drawing \(\boldsymbol{\mathfrak{q}}_{j}^{(s+1)}\) for all features, resulting in the latent features of all features and observations \(\boldsymbol{\mathbf{\mathfrak{q}}}^{(s+1)}\). Here, the same applies with the interaction matrix \(\boldsymbol{\delta}\) that is drawn holding \(\boldsymbol{\mathbf{\mathfrak{q}}}^{(s+1)}\). The formal algorithm is reproduced partially hereafter.
Initialization
First, P is computed according to the formulation of pk, ℓ given above. Second, related to the Metropolis-Hastings algorithm, we need to initialize the interaction matrix \(\boldsymbol{\delta}^{(0)}\) following a uniform distribution, as hypothesized earlier. Related to the SEM algorithm, \(\boldsymbol{\mathbf{\mathfrak{q}}}^{(0)}\) is also initialized uniformly (from an equiprobable multinouilli distribution).
S-steps
Then, the SEM algorithm begins: SEM-Gibbs sampler is applicable and \(\boldsymbol{\mathfrak{q}}_j^{(s+1)}\) can be drawn according to:
$$\begin{aligned}
\boldsymbol{\mathfrak{q}}_j^{(s)} & \sim p_{\hat{\boldsymbol{\theta}}^{(s-1)}}(y | \boldsymbol{\mathfrak{q}}_{-\{j\}}^{(s-1)}, \cdot, \boldsymbol{\delta}^{(s-1)}) p_{\hat{\boldsymbol{\alpha}}^{(s-1)}}(\cdot | x_j).\end{aligned}$$
At this point, \(\boldsymbol{\delta}^{(s)}\) can be computed from the Metropolis-Hastings algorithm similarly to the preceding section.
M-steps
Then the logistic regression parameters are estimated:
$$\begin{aligned}
{\boldsymbol{\theta}}^{(s)} & = \arg\!\max_{\boldsymbol{\theta}} \ell(\boldsymbol{\theta} ; \boldsymbol{\mathbf{\mathfrak{q}}}^{(s)}, \boldsymbol{\mathbf{y}}, \boldsymbol{\delta}^{(s)}) \\
{\boldsymbol{\alpha}}_j^{(s)} & = \arg\!\max_{\boldsymbol{\alpha}_j} \ell(\boldsymbol{\alpha}_j ; \boldsymbol{\mathbf{x}}_j, \boldsymbol{\mathbf{\mathfrak{q}}}^{(s)}_j) \text{ for } 1 \leq j \leq d.\end{aligned}$$
Quantization and interaction provider
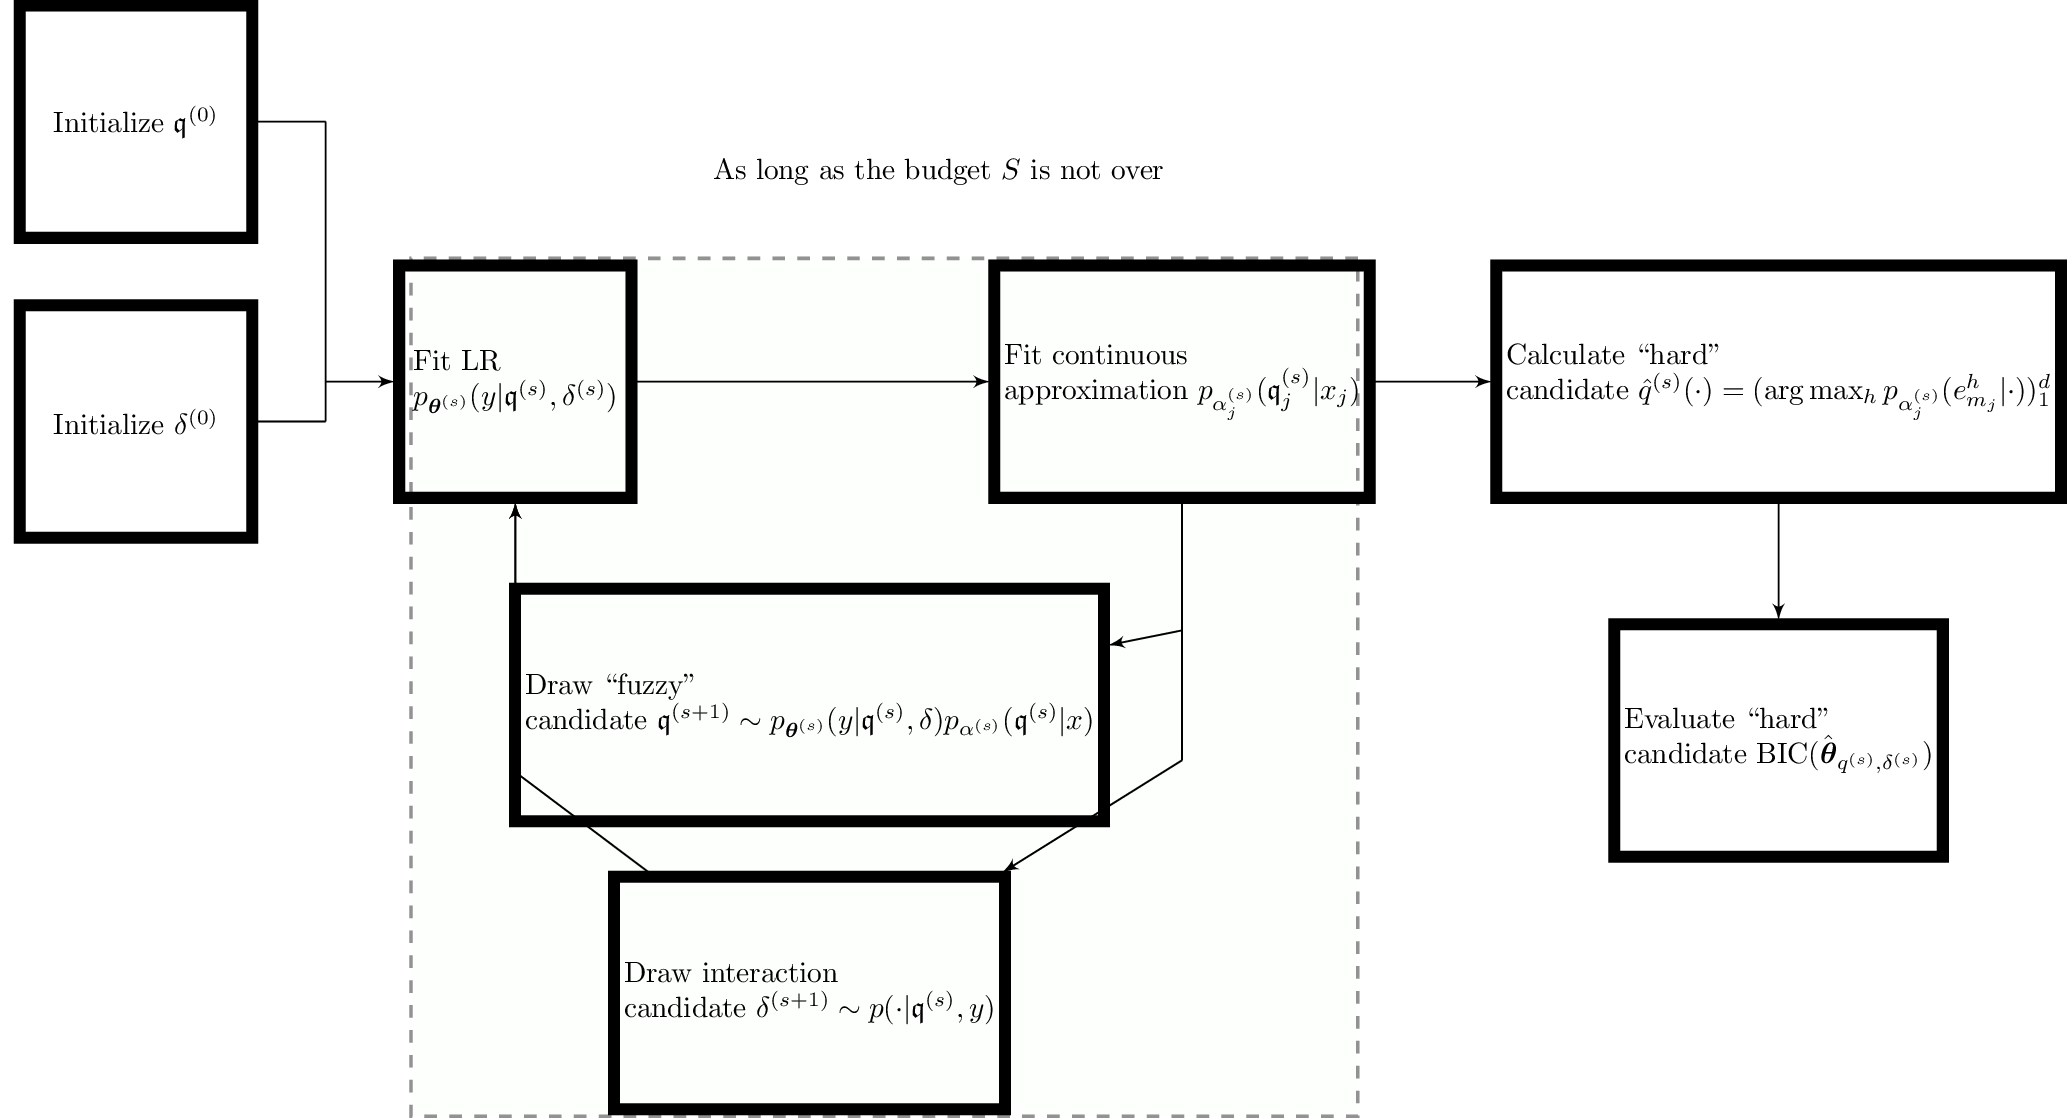
We iterate this procedure for a user-defined number of steps S. Parallel to these steps, “hard” quantizations \(\hat{\boldsymbol{q}}^{(s)}\) are derived from the MAP rule and their associated logistic regression coefficients \(\hat{\boldsymbol{\theta}}^{(s)}\) follows from the MLE:
$$\hat{\boldsymbol{\theta}}^{(s)} = \arg\!\max_{\boldsymbol{\theta}} \ell(\boldsymbol{\theta}; \hat{\boldsymbol{q}}^{(s)}(\boldsymbol{\mathbf{x}}), \boldsymbol{\mathbf{y}}, \boldsymbol{\delta}^{(s)}).$$
The best quantization and interaction matrix can then be selected via BIC, or any other model selection tool as emphasized earlier.
This procedure is much less costly than what could originally be thought of: the d(d − 1)/2 logistic regression necessary to initialize the Metropolis-Hastings algorithm are still needed, but only once, and at each step, only one logistic regression, supplementary to the complexity of the original glmdisc-SEM approach, is needed.
The full algorithm is described schematically in Figure [2]. We turn to numerical experiments in the next section on simulated, benchmark and real data.
Numerical experiments
The proposed algorithm for interaction screening is first tested on simulated data, to show empirically its consistency, then on benchmark datasets and on Credit Scoring data from CACF. The same scheme is applied for the glmdisc algorithm augmented with the interaction screening approach as described in the previous section.
Simulated data
In this first part, focus is given on showing empirically the consistency of the approach. Two continuous features \(x_1\) and \(x_2\) are sampled from the uniform distribution on [0, 1] and discretized by using
$$\boldsymbol{q}_1(\cdot)=\boldsymbol{q}_2(\cdot) = ({1}_{]-\infty,1/3]}(\cdot),{1}_{]1/3,2/3]}(\cdot),{1}_{]2/3,\infty[}(\cdot)).$$
Here, we have d = 2 and m1 = m2 = 3 and the cutpoints are cj, 1 = 1/3 and cj, 2 = 2/3 for j = 1, 2. Setting \(\boldsymbol{\theta}^{1}=(0,-2,2,0,-2,2,0)\), \(\boldsymbol{\delta}^{1} = 0\), \(\boldsymbol{\theta}^{2} = (\boldsymbol{\theta}^{1},\boldsymbol{\theta}_{1,2})\), where θ1, 2r, 3 = θ1, 23, t = 0 for all 1 ≤ r, t ≤ 3 as defined in Section 1.1, θ1, 21, 1 = θ1, 22, 2 = 4 and θ1, 21, 2 = θ1, 22, 1 = − 4, \(\boldsymbol{\delta}^{2} = 1\); the target feature y is then sampled from \(p_{\boldsymbol{\theta}^{o}}(\cdot | \boldsymbol{q}(\boldsymbol{\mathbf{x}}), \boldsymbol{\delta}^{o}), o = \{1,2\}\) via the logistic model. Two cases are studied:
First, we assess that in the absence of a true interaction, no interaction is found by glmdisc while quantizing the data, so that we simulate \(Y \sim p_{\boldsymbol{\theta}^{1}}\) and provide \(\boldsymbol{\mathbf{x}}\);
Second, we assess that in the presence of a true interaction, it is discovered by glmdisc while quantizing the data, so that we simulate \(Y \sim p_{\boldsymbol{\theta}^{2}}\) and provide \(\boldsymbol{\mathbf{x}}\).
Note that the interaction screening procedure is also applicable to continuous features, which is not tested here. These 2 experiments are run 100 times with n = {1, 000, 10, 000} and histograms are given in Table [1]. They show good performance and empirical consistency.
[1]
| Algorithm | n | (a) | \(\hat{\boldsymbol{\delta}}\) | (b) | \(\hat{\boldsymbol{\delta}}\) | |
|---|---|---|---|---|---|---|
| glmdisc w.o. provided quantization | 1, 000 | |||||
| glmdisc w.o. provided quantization | 10, 000 |
Benchmark datasets
Half of the datasets do not benefit from the enriched model space but the performance of glmdisc without interactions was already high such that it is likely that the proposed decision boundaries were already close to the oracle and interaction coefficients are not significant. The other half shows a slightly superior performance.
[2]
| Dataset | ALLR | ad hoc methods | glmdisc-NN | glmdisc-SEM | glmdisc-SEM w. interactions |
| Adult | 81.4 (1.0) | 85.3 (0.9) | 80.4 (1.0) | 81.5 (1.0) | 81.5 (1.0 - no interaction) |
| Australian | 72.1 (10.4) | 84.1 (7.5) | 92.5 (4.5) | 100 (0) | 100 (0 - no interaction) |
| Bands | 48.3 (17.8) | 47.3 (17.6) | 58.5 (12.0) | 58.7 (12.0) | 58.8 (13.0) |
| Credit | 81.3 (9.6) | 88.7 (6.4) | 92.0 (4.7) | 87.7 (6.4) | 87.7 (6.4 - no interaction) |
| German | 52.0 (11.3) | 54.6 (11.2) | 69.2 (9.1) | 54.5 (10) | 56.5 (9.0) |
| Heart | 80.3 (12.1) | 78.7 (13.1) | 86.3 (10.6) | 82.2 (11.2) | 84.5 (10.8) |
In addition to these datasets, we used glmdisc-SEM on medicine-related datasets for a seminar talk in a biostatistics research team. These new benchmark datasets are Pima (available in R, n = 768, d = 8), Breast (available in R and also available on UCI under the name “Breast Cancer Wisconsin (Original)”, n = 699, d = 10) and Birthwt (available in R, n = 189, d = 16). Table [3] shows the obtained Gini indices: for Pima, ALLR performs best such that the linearity assumption is probably “not as false” as in our motivational example; for Breast, ALLR, glmdisc-SEM and glmdisc-SEM w. interactions show similar results, but at least for Credit Scoring practitioners, the resulting quantized scorecard is more interpretable. For Birthwt, glmdisc-SEM w. interactions clearly outperforms all other approaches.
[3]
| Pima | Breast | Birthwt | ||
|---|---|---|---|---|
| ALLR | 73.0 | 94.0 | 34.0 | |
| ALLR LR w. interactions | 60.0 | 51.0 | 15.0 | |
| glmdisc-SEM | 57.0 | 93.0 | 18.0 | |
| glmdisc w. interactions | 62.0 | 95.0 | 54.0 |
Real data from Crédit Agricole Consumer Finance
The enriched model space allows obviously for better predictive performance, provided this space can be effectively visited by the Metropolis-Hastings algorithm, itself very dependent of the propositional transition probability. It seems effective on real data since it yields the best performance on most datasets, significantly above all other methods, at the price of higher computational cost.
[4]
| Portfolio | ALLR | Current performance | ad hoc methods | glmdisc-NN | glmdisc-SEM | glmdisc-SEM w. interactions |
| Automobile | 59.3 (3.1) | 55.6 (3.4) | 59.3 (3.0) | 58.9 (2.6) | 57.8 (2.9) | 64.8 (2.0) |
| Renovation | 52.3 (5.5) | 50.9 (5.6) | 54.0 (5.1) | 56.7 (4.8) | 55.5 (5.2) | 55.5 (5.2 - no interaction) |
| Standard | 39.7 (3.3) | 37.1 (3.8) | 45.3 (3.1) | 43.8 (3.2) | 36.7 (3.7) | 47.2 (2.8) |
| Revolving | 62.7 (2.8) | 58.5 (3.2) | 63.2 (2.8) | 62.3 (2.8) | 60.7 (2.8) | 67.2 (2.5) |
| Mass retail | 52.8 (5.3) | 48.7 (6.0) | 61.4 (4.7) | 61.8 (4.6) | 61.0 (4.7) | 60.3 (4.8) |
| Electronics | 52.9 (11.9) | 55.8 (10.8) | 56.3 (10.2) | 72.6 (7.4) | 62.0 (9.5) | 63.7 (9.0) |
Conclusion
The essentially industrial problem of introducing pairwise interactions in a supervised multivariate classification setting was formalized and a new approach, relying on a Metropolis-Hastings algorithm has been proposed. This algorithm relies on the use of logistic regression, although other predictive models can be plugged in place of \(p_{\boldsymbol{\theta}}\).
The true underlying motivation was to perform interaction screening while quantizing data using the approach developed in an earlier post: glmdisc. The experiments showed that, as was sensed empirically by statisticians in the field of Credit Scoring, interactions between quantized features can indeed provide better models than without interactions, or standard logistic regression. This novel approach allows practitioners to have a fully automized and statistically well-grounded tool that achieves better performance than both ad hoc industrial practices and academic quantization heuristics at the price of decent computing time but much less of the practitioner’s valuable time.
Moreover, in Section 1.3.3, we set a uniform prior on the interaction matrix to simplify subsequent calculations and because it made sense for the Credit Scoring industry. However, without much modifications nor difficulty, it can be re-introduced which is of particular interest to e.g. biostatistics applications where a lot more features are considered and expert-knowledge is available to “guide” the Markov Chain by choosing an appropriate prior over the interaction matrix.
| [1] | James Jaccard. Interaction effects in logistic regression, volume 135. SAGE Publications, Incorporated, 2001. [ bib ] |
| [2] | James Jaccard, Jim Jaccard, and Robert Turrisi. Interaction effects in multiple regression. Number 72. Sage, 2003. [ bib ] |
| [3] | Craig Morgan, Ulrich Reininghaus, Abraham Reichenberg, Souci Frissa, Matthew Hotopf, Stephani L Hatch, SELCoH Study Team, et al. Adversity, cannabis use and psychotic experiences: evidence of cumulative and synergistic effects. The British Journal of Psychiatry, 204(5):346-353, 2014. [ bib ] |
| [4] | Vincent Calcagno, Claire de Mazancours, et al. glmulti: an r package for easy automated model selection with (generalized) linear models. 2010. [ bib ] |
| [5] | Robert Tibshirani. Regression shrinkage and selection via the lasso. Journal of the Royal Statistical Society. Series B (Methodological), pages 267-288, 1996. [ bib ] |
| [6] | Mee Young Park and Trevor Hastie. Penalized logistic regression for detecting gene interactions. Biostatistics, 9(1):30-50, 2007. [ bib ] |
| [7] | Tong Tong Wu, Yi Fang Chen, Trevor Hastie, Eric Sobel, and Kenneth Lange. Genome-wide association analysis by lasso penalized logistic regression. Bioinformatics, 25(6):714-721, 2009. [ bib ] |
| [8] | Jacob Bien, Jonathan Taylor, and Robert Tibshirani. A lasso for hierarchical interactions. Annals of statistics, 41(3):1111, 2013. [ bib ] |
| [9] | Haitian Wang, Shaw-Hwa Lo, Tian Zheng, and Inchi Hu. Interaction-based feature selection and classification for high-dimensional biological data. Bioinformatics, 28(21):2834-2842, 2012. [ bib ] |
| [10] | Charles Kooperberg and Ingo Ruczinski. Identifying interacting snps using monte carlo logic regression. Genetic epidemiology, 28(2):157-170, 2005. [ bib ] |
| [11] | Holger Schwender and Katja Ickstadt. Identification of snp interactions using logic regression. Biostatistics, 9(1):187-198, 2007. [ bib ] |
| [12] | Noah Simon and Robert Tibshirani. A permutation approach to testing interactions for binary response by comparing correlations between classes. Journal of the American Statistical Association, 110(512), 2015. [ bib ] |
| [13] | Yingying Fan, Yinfei Kong, Daoji Li, Zemin Zheng, et al. Innovated interaction screening for high-dimensional nonlinear classification. The Annals of Statistics, 43(3):1243-1272, 2015. [ bib ] |
| [14] | Yang Li and Jun S Liu. Robust variable and interaction selection for logistic regression and general index models. Journal of the American Statistical Association, pages 1-16, 2018. [ bib ] |
| [15] | Can Yang, Zengyou He, Xiang Wan, Qiang Yang, Hong Xue, and Weichuan Yu. Snpharvester: a filtering-based approach for detecting epistatic interactions in genome-wide association studies. Bioinformatics, 25(4):504-511, 2008. [ bib ] |
| [16] | Xiang Zhang, Shunping Huang, Fei Zou, and Wei Wang. Team: efficient two-locus epistasis tests in human genome-wide association study. Bioinformatics, 26(12):i217-i227, 2010. [ bib ] |
| [17] | Jiahan Li, Jun Dan, Chunlei Li, and Rongling Wu. A model-free approach for detecting interactions in genetic association studies. Briefings in bioinformatics, 15(6):1057-1068, 2013. [ bib ] |
| [18] | Changzheng Dong, Xun Chu, Ying Wang, Yi Wang, Li Jin, Tieliu Shi, Wei Huang, and Yixue Li. Exploration of gene-gene interaction effects using entropy-based methods. European Journal of Human Genetics, 16(2):229, 2008. [ bib ] |
| [19] | Yu Zhang and Jun S Liu. Bayesian inference of epistatic interactions in case-control studies. Nature genetics, 39(9):1167, 2007. [ bib ] |
| [20] | Xiang Wan, Can Yang, Qiang Yang, Hong Xue, Xiaodan Fan, Nelson LS Tang, and Weichuan Yu. Boost: A fast approach to detecting gene-gene interactions in genome-wide case-control studies. The American Journal of Human Genetics, 87(3):325-340, 2010. [ bib ] |
| [21] |
Emilie Lebarbier and Tristan Mary-Huard.
Le critère BIC : fondements théoriques et
interprétation.
(RR-5315):17, 2004.
[ bib |
http |
.pdf ]
Keywords: Critère bayésien ; approximation de Laplace ; consistance pour la dimension ; critère de sélection de modèles |
| [22] | W Keith Hastings. Monte carlo sampling methods using markov chains and their applications. Biometrika, 57(1):97-109, 1970. [ bib ] |
| [23] | Sean P Meyn and Richard L Tweedie. Markov chains and stochastic stability. Springer Science & Business Media, 2012. [ bib ] |
| [24] | Clément Vital, Scoring pour le risque de crédit : variable réponse polytomique, sélection de variables, réduction de la dimension, applications. URL: http://www.theses.fr/2016REN1S111., 2016. |
| [25] | William D Berry, Jacqueline HR DeMeritt, and Justin Esarey, Testing for interaction in binary logit and probit models: Is a product term essential? American Journal of Political Science 54.1, 2010. |