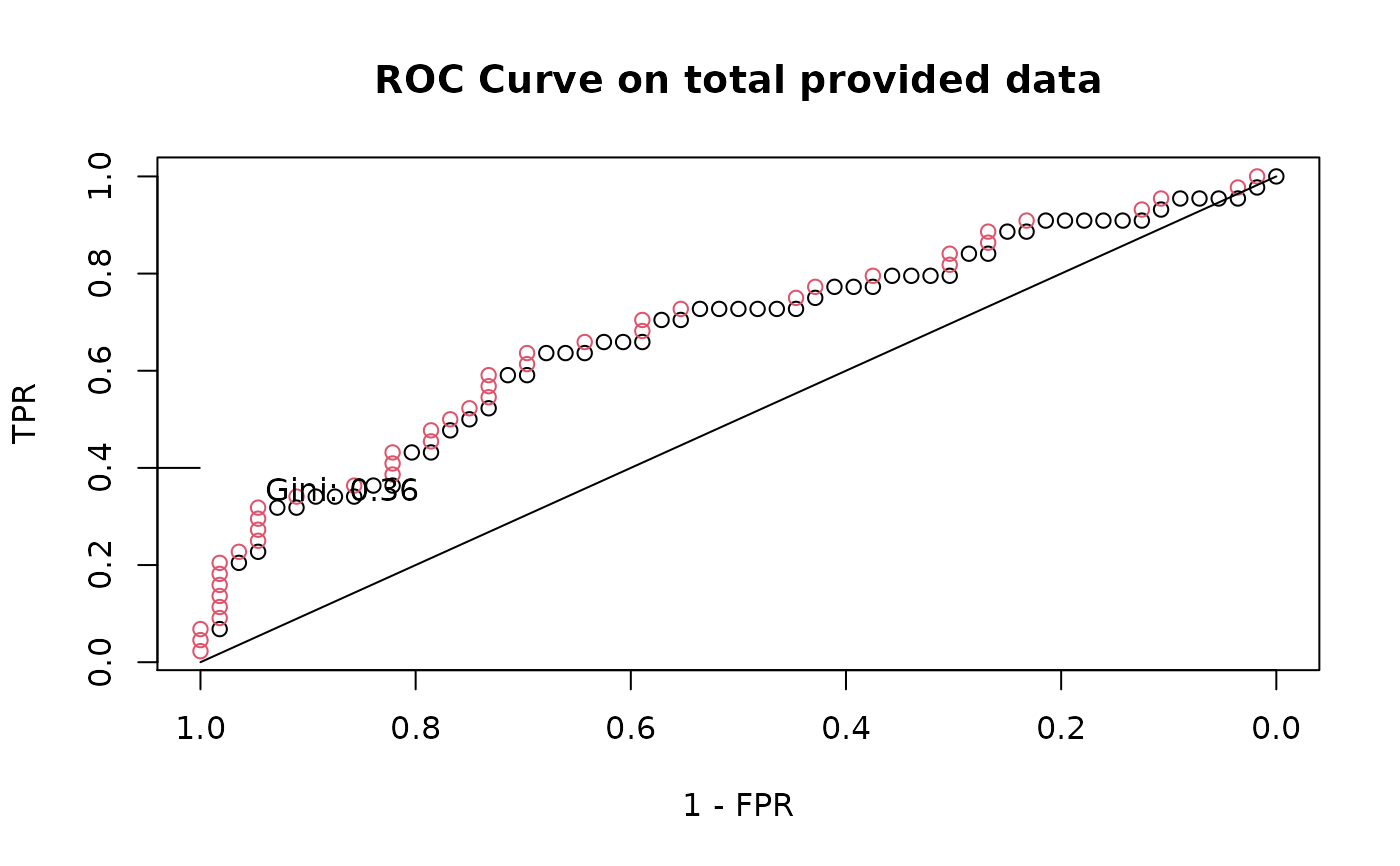
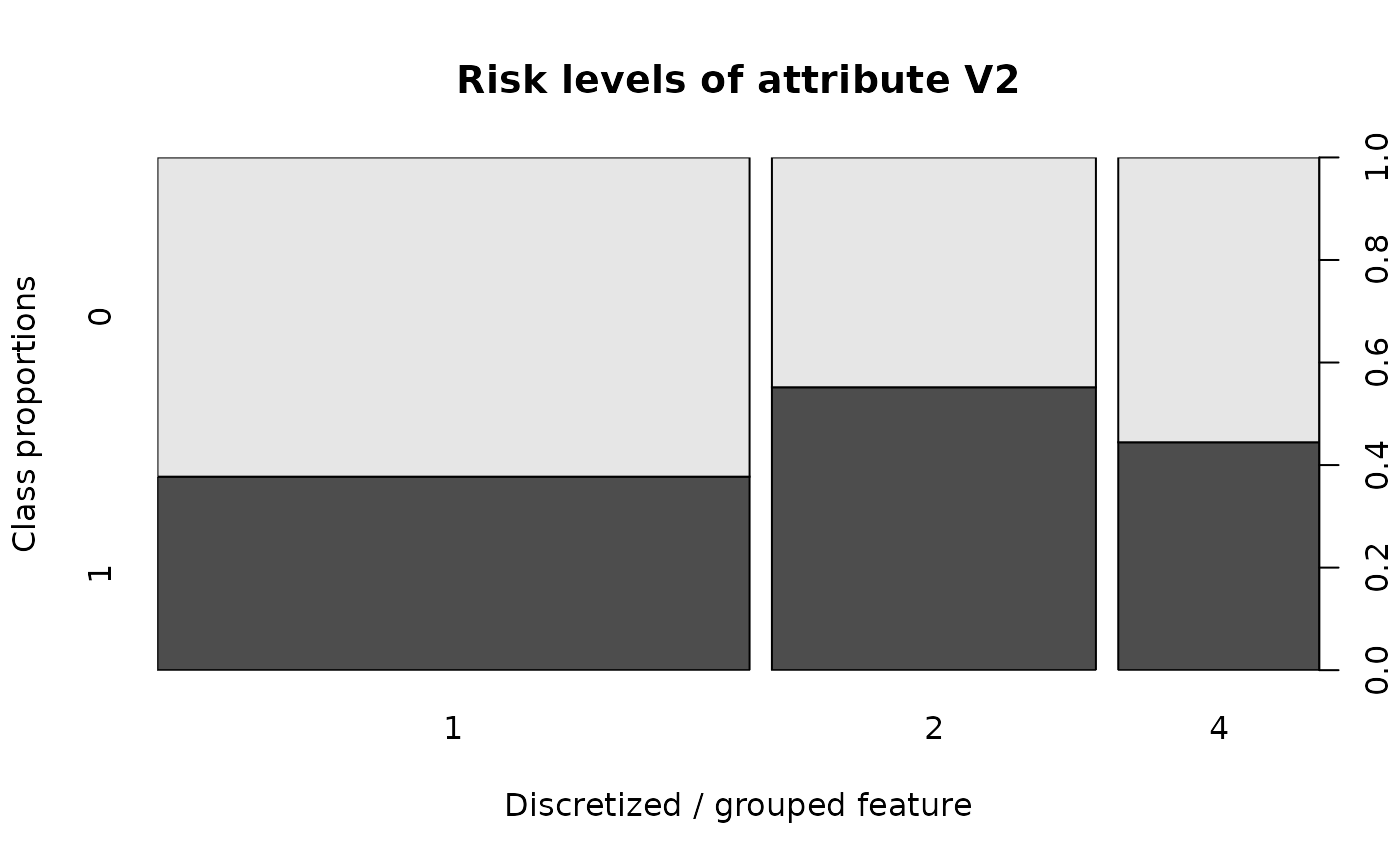
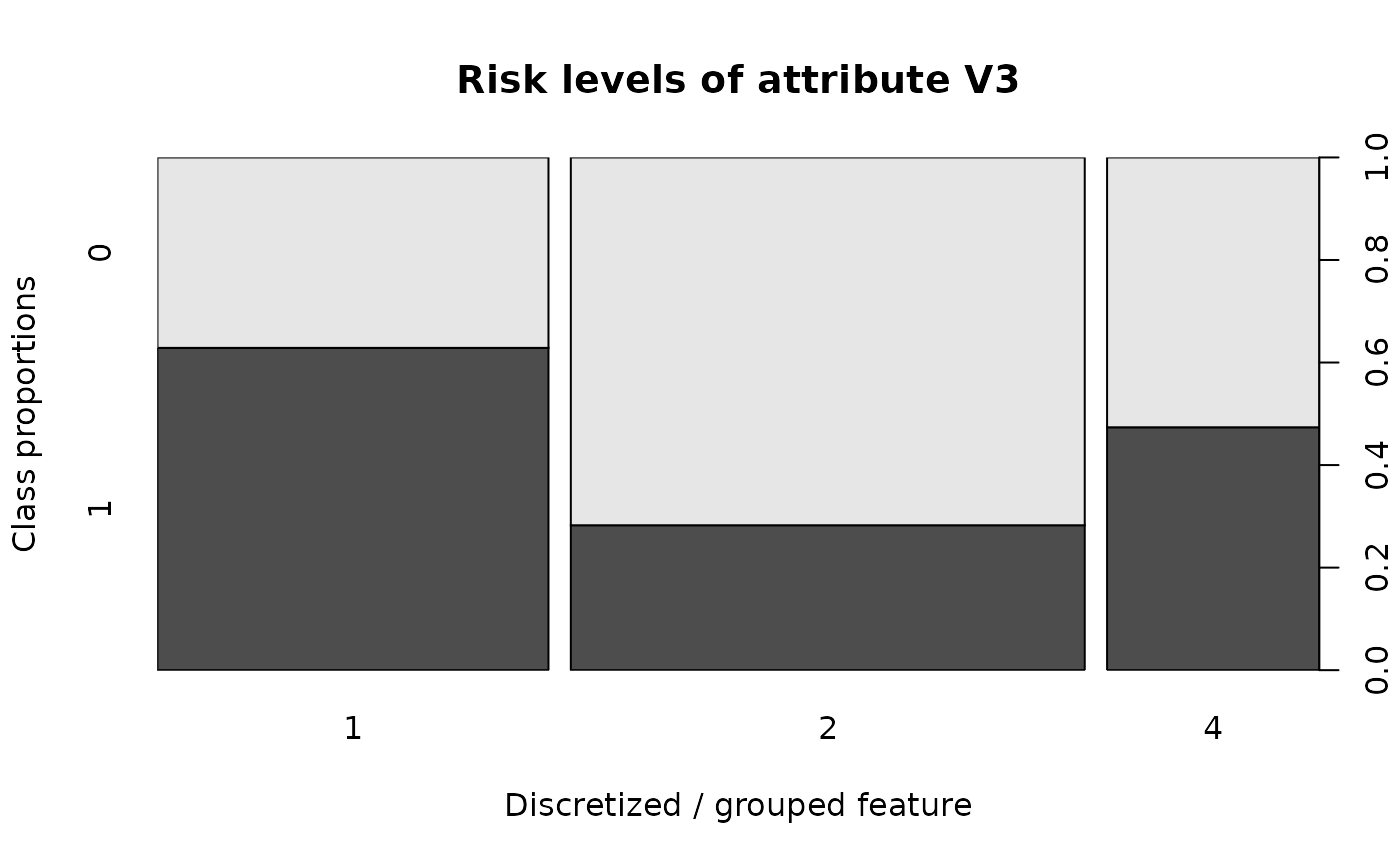
This defines the plot method which will plot some useful graphs for the discretization scheme of S4 class glmdisc
plot.glmdisc(x)

# S4 method for glmdisc,missing
plot(x)
Arguments
| x | The S4 |
|---|
Examples
# Simulation of a discretized logit model
x <- matrix(runif(300), nrow = 100, ncol = 3)
cuts <- seq(0, 1, length.out = 4)
xd <- apply(x, 2, function(col) as.numeric(cut(col, cuts)))
theta <- t(matrix(c(0, 0, 0, 2, 2, 2, -2, -2, -2), ncol = 3, nrow = 3))
log_odd <- rowSums(t(sapply(seq_along(xd[, 1]), function(row_id) {
  sapply(
    seq_along(xd[row_id, ]),
    function(element) theta[xd[row_id, element], element]
  )
})))
y <- rbinom(100, 1, 1 / (1 + exp(-log_odd)))

sem_disc <- glmdisc(x, y,
  iter = 50, m_start = 4, test = FALSE,
  validation = FALSE, criterion = "aic"
)
plot(sem_disc)